
Team leaders and managers are right when they say that brainstorming is the starting point when trying to unearth solutions to complex challenges.
Unfortunately, a lot of people don’t brainstorm correctly—or avoid brainstorming altogether due to past failures. In either case, it amounts to the same thing: they miss out on the advantages of a well-thought-out brainstorming session.
But as with all challenges, there is a solution available. Enter the affinity diagram. This visual tool provides a proven framework to organize ideas or create brainstorming sessions that yield effective results.
What Is an Affinity Diagram?

Invented in 1960 by Jiro Kawakita, the affinity diagram is also known as the affinity map, affinity chart, or the KJ method. Affinity maps are perfect for sorting long lists of ideas or large amounts of data into related groups.
This post will walk you through the benefits of an affinity diagram and the steps to easily create one with an interactive whiteboard device.
How Do Affinity Diagrams Work?

Before creating an affinity diagram, there are some critical factors that need to be considered. First, think about how you want to create the affinity map. Create a plan of action and then brainstorm some ideas. Most notably, choose a facilitator. A facilitator will come in handy in monitoring the team during the affinity mapping process.
That said, the easiest way to understand how an affinity diagram works is to see an example of one.
Let’s say you want to improve your customer experience. Share the main concept with your team and give them time to brainstorm and record their ideas. Now you group similar ideas together and come up with a visual depiction of the action you wish to take to boost your customer experience.
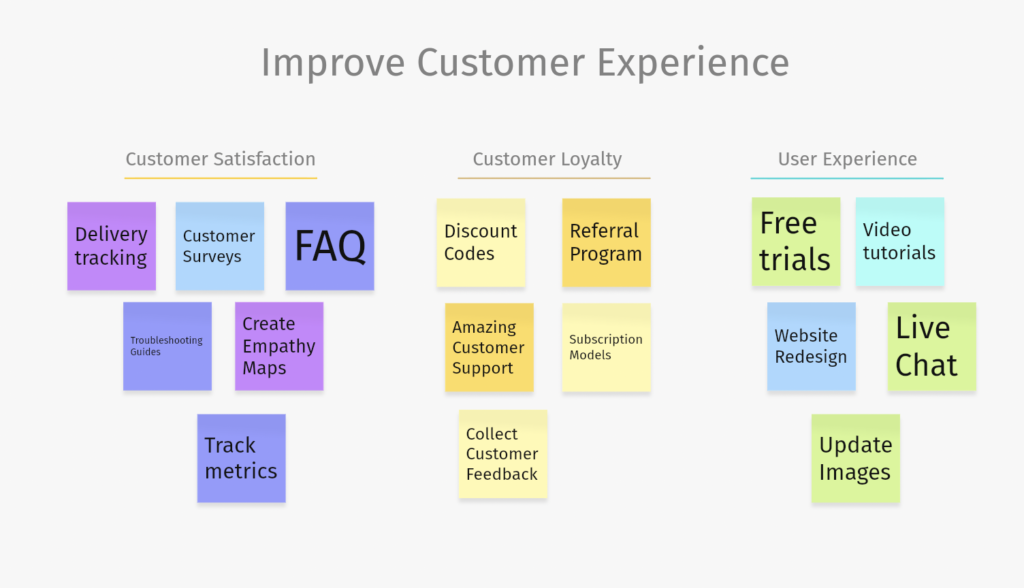
The diagram is quite simple to create. And it makes it easy to deconstruct complex ideas or data, allowing every team member to appreciate the different elements of your main concept.
What Are Affinity Diagrams Used For?

Affinity chats can help define a project or concept. They can broaden or narrow the project scope depending on how overwhelming the amount of information feels to you.
Specifically, here are instances when an affinity map can be used:
- You have many ideas or facts to consider, but the sheer volume of ideas makes them disorganized and chaotic.
- The problem you’re considering is complex or large to think through.
- Your team is stuck in a cycle of repetitive thinking, and you always seem to identify the same categories each time you brainstorm.
- Your group has to reach a consensus, and they want the facts presented rationally in order to do so.
Benefits of Affinity Diagrams

Affinity diagramming has various major benefits. Let’s explore some of them below:
Grouping and ranking large chunks of data
Affinity maps help in identifying novel and unique connections between various elements of a given project. Synthesizing information, ideas, and facts into a simple visual representation such as this enables the team to develop new solutions that they might have otherwise missed.
Summing up the major insights, pain points, user needs, and gaps
It can be challenging to reach a consensus when entrusted with synthesizing extensive research data or bringing coherence to a diverse set of ideas. Affinity diagramming is handy in such a situation. Clustering the ideas and data makes it easier to narrow down on specific design directions.
Giving a voice to varied perspectives
Affinity mapping is an exercise that offers an open channel for team members to air their ideas and thoughts freely. It’s a great place for everyone to use their imagination and develop crafty solutions to designated issues.
Steps on How to Make Affinity Diagrams

The process of creating an affinity map is straightforward and simple. You should be able to complete one in a session or two, although it may depend on the size of the information or data you’re working with. The more information or data there is to cluster, the longer you can expect the process to take. Here’s how to do it:
Step 1: Brainstorm Ideas or Collect Data
The first step to affinity drawing is collecting data or ideas. If you’re trying to make sense of a project or solve a problem, this will entail holding a brainstorming session in the office or boardroom—or whatever location best suits you. Alternatively, you can use video conferencing tools to hold a hybrid meeting.
Encourage everyone to start on their own when brainstorming to prevent anyone from being influenced by their colleagues’ ideas too early in the process.
It can help to formulate whatever issue you want to unravel into a “How might we…” statement. For instance, “How can we encourage younger customers to buy our product?” or “How can we increase our sales goals this year?”
If you’re relying on research findings for your brainstorming session, you may instead have to write out all of the qualitative data so that it can be sorted and organized during the mapping session.
Step 2: Cluster Information by Common Themes
After everyone has given their insights and ideas, or you’ve retrieved the data or information you already have, start grouping data points and ideas based on common themes.
Begin with a few and look for commonalities. Are they highlighting the same issue? If yes, cluster them together. If not, separate them. Let every idea be in its own group. You can color-code the clusters/groups if this makes your sorting job easier.
Some teams prefer to do this activity with sticky notes on a wall or, better yet, a smart whiteboard. A smart whiteboard can be a collaborative and fun way to work through problems alongside your team, whether everyone’s in the same room or working remotely. Additionally, you have access to a digital record that you can reference at any time you want.
During the sorting period, if you come across any duplicate ideas, feel free to remove them—but exercise caution while deleting them. You don’t want to quickly disregard ideas that could be valuable.
Step 3: If Necessary, Arrange Groups by Priority
This step is not mandatory. However, if you’d like, you can opt to prioritize the groups once all ideas are organized.
For instance, if you’re investigating an issue and one of the groups seems to have a bigger impact than others, you may prioritize that group so that the issues are addressed first.
Step 4: Create an Action Plan
The ultimate goal of affinity diagrams is to take your data or ideas and transform them into something actionable. Therefore, making an affinity diagram is your first step in creating a plan of action. If you want some more structure along the way, make sure to take advantage of the many strategic planning or project planning templates out there to continue your progress.
Building Your Affinity Diagram with Vibe

When you pair affinity drawing with an interactive whiteboard like Vibe, you can transform your project from ideation to action.
First, Vibe can help bring your brainstorming session to the next level, with team members adding their thoughts to a cloud-backed whiteboard in real-time—from any device and any location. Secondly, Vibe offers pre-built whiteboard templates to jumpstart your affinity mapping. The templates allow you to jump straight into the drawing process without starting from scratch.
Begin by selecting the best template for your affinity map, whether that’s the Project Management template, the Brainwriting Template, the Mind Mapping template, or your own custom template. Next, follow the steps below:
- Brainstorm and record: Give your team a few minutes to brainstorm their ideas via the Vibe Board. Vibe allows even your remote team to write, draw, erase, and annotate on the same board, just like they’re in the same room. Better yet, these ideas are all instantly saved in the cloud for easy sharing—and to make sure that no thought gets lost.
- Identify the similarities: Discuss any similarities with your team and start to draw relations between concepts. Teams can also use sticky notes to share their viewpoints and comments, or use Vibe’s annotation features to mark up the affinity map.
- Cluster your interrelated concepts in the template. Replicate this until you have categorized all of your concepts in the template.
- Tack action: Review the groups together and take action.
Ready to create your first affinity map? Get started with a Vibe Board today and see how easy it is.
{{< blog/cta-download-new content=”S1 Product Brochure” extra=”false” pdf=”https://vibe.us/pdf/s1-product-brochures/?utm_campaign=affinity-diagram&utm_medium=blog&utm_source=blog“>}}
FAQs
Is affinity mapping a research method?
Affinity mapping is not a research method per se. However, affinity diagramming can be used for various research and analysis purposes—from thematic analysis to evaluating qualitative data. Consider research projects where you’re asking more open-ended questions. Affinity diagrams are ideal when you want to synthesize that type of data.
What is affinity mapping in agile?
Agility diagramming is an agile technique that helps teams to come to a consensus after a brainstorming session, user research survey, or usability testing. It comes in handy when you have voluminous data to sort and when you want to narrow down all that data into solutions the entire team can agree on.
How do you present affinity mapping?
There are several ways to create affinity maps for presentation. However, one of the most effective methods is to use interactive whiteboards. You can use the Vibe Board’s pre-built templates to create your affinity map quickly, whether you’re working alone or with a hybrid team. Most importantly, Vibe’s technology allows your team members to make notes in real-time, mark up images, and share screens.