All businesses, no matter the industry, have to face some unexpected challenges to get a project from start to finish. Whether it’s product design, brainstorming, or just general problem-solving, identifying the cause of the issue at hand is essential to avoid future occurrences. However, it’s not always easy to pin down the particular source of the issue. In such a case, having a systematic approach might be quite helpful. That’s where the fishbone diagram comes in.
What Is a Fishbone Diagram?
The fishbone diagram, also known as the Ishikawa diagram, is a modern problem-solving tool that can be used to determine the root of any existing or potential problems. It provides a visual picture of the many factors that might be at play in order to help identify the root of an issue. There are two ways you can use this tool: proactively and reactively.
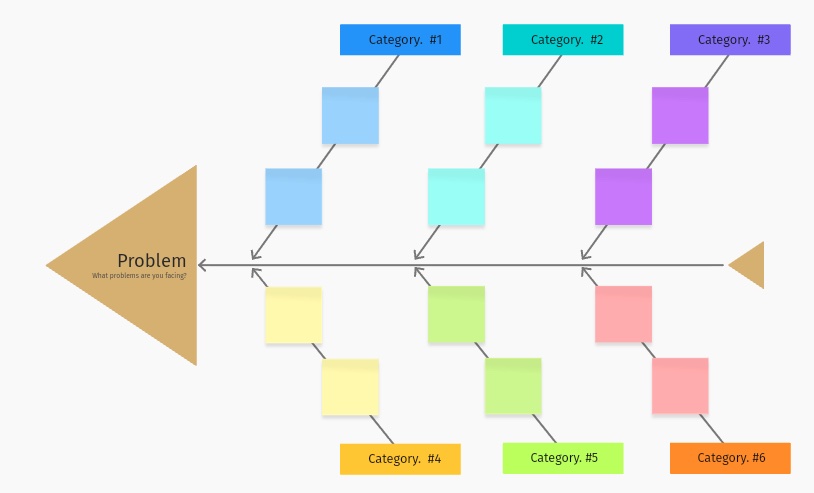
Then, what’s up with the name “fishbone”? Actually, there’s no specific reason behind its name, other than the fact that its structure resembles a fish skeleton. The question is printed in the fish’s head, which is on the rightmost section. The spine goes left to right, with skeletal arrows indicating the major contributors. The underlying reasons are broken down into their parent categories.
How to Use the Fishbone Diagram

Fishbone diagrams are useful for practically every business, as well as any individual or group that is trying to solve an issue or build product roadmaps.
Fishbone diagrams were first designed as a tool for quality control, but you can find them useful in the following situations as well:
- Enhancing community problem-solving efforts and maintaining focus;
- Analyzing a complex issue with numerous potential causes;
- Looking at a topic from a fresh perspective;
- Determining what the likely underlying reasons are for an outcome or an issue;
- Discovering where a process is failing and why, as well as to locate any bottlenecks that may be present;
- Speeding up the thought process in situations when more traditional methods of problem-solving would take too much time;
- Tackling difficult problems in creative new ways and coming up with innovative solutions
Benefits of Fishbone Diagrams

A fishbone diagram is a fantastic tool for getting to the core cause of a problem and treating it in a meaningful way.
Here are some of the key benefits of using a fishbone diagram to problem-solve:
Effective Visualization
A fishbone diagram is a useful visualization tool that may assist you in determining the causes of the problems. Sometimes, breaking down a problem with easy-to-understand visuals can be the breakthrough you needed all along. Even better, now all the steps required to fix the problem are laid out in front of you in the diagram.
Make the Team Focus
A fishbone diagram helps your team maintain focus while addressing both the challenges at hand and the essential procedures to address them. Problem-solving can be a fantastic way to get the team together, and it ensures that these issues won’t pop up in the future, removing potential stressors from the team.
Chance for Advancement
Since all of the processes are shown in one straightforward diagram, looking for specific process improvements is easy. A fishbone diagram can help you visualize and understand dynamics you may have otherwise overlooked when problem-solving using another method.
Collaborative Brainstorming Process
One of the most significant advantages of using this diagram is that it allows the team to brainstorm together. As we mentioned before, nothing gets the team together like a good brainstorming session. It’s a great team-building exercise and makes sure that everyone in the team is heard and can contribute to the process.
Discover the Problems Quickly and Easily
Additionally, the tool makes it much simpler for you to recognize problems, which is a vital step for doing an in-depth analysis. As a result, the fishbone diagram is highly beneficial for recognizing the problems that the stakeholders face and the required solutions to those problems.
Increases Individual and Team Understanding
The use of a fishbone diagram helps to guarantee that all members of the team are on the same page. This tool is a must-have for the company or team if they are having trouble assessing the problem or maintaining the speed of the work.
Fishbone Diagram Examples

Example 1
For the first example of a fishbone diagram, let’s say a wrong, late, or damaged delivery is the issue at hand. The list of potential causes is long and might include incorrect address labels, damaged goods due to poor packing, and shipping mistakes. In order to categorize the primary reasons, we may use a fishbone diagram to display the data.
The problem could be bad weather, traffic, vehicle problems, or even with the staff of the company—determining which cause is at play will help cater to the issue.
Example 2
Another use for a fishbone example is solving issues in food service. Advisors from a fast food joint can figure out what has the potential to go wrong while prepping an order to ensure customer service, employee satisfaction, and efficiency are all at their best. Fishbone diagrams can help them identify what’s at play in disrupting meal prep: Is it the storage and cooking equipment, or hygiene? Or is it the incorrect amount of spices, or a flawed recipe? Determining all of this will help find any underlying causes to meal prep mishaps.
How to Make a Fishbone Diagram

So, what are the specifics on how to create a fishbone diagram? First, identify everyone who’s engaged with or impacted by the problems that you’re trying to solve. This way, you’ll be able to bring a group with you.
- Identify a problem statement: The members of the relevant team, as well as the stakeholders, should come up with a statement that characterizes the issue—and they should all agree on it. This is determined by a horizontal arrow pointing in the direction of the diagram head.
- Brainstorming the primary reasons: In order to make the brainstorming session more efficient, the underlying causes of the issue are organized into groups such as personnel, methodology, equipment, material, medium, and metric. The categories are represented graphically as fish bones, with arrows leading to the fish’s spinal column in the diagram.
- Analyze other causes: The assessment team should uncover contributing reasons to each main cause group using methods to root cause analysis. To do this, the analysis team should first brainstorm all potential causes. On the diagram, they’re shown in the form of branches that extend from the fish’s bones. The layered bones that are formed as a result of recognizing sub-causes demonstrate the causal linkages between the different factors.
- Examine the diagram: The team analyzes all of the primary reasons, as well as the factors that contributed to the problem, by asking ‘why’ questions. In the event that the underlying cause of the issue being discussed is not identified, the brainstorming process will continue while the attention is shifted to regions of the diagram that aren’t yet filled out with ideas.
Tools for Creating Fishbone Diagrams

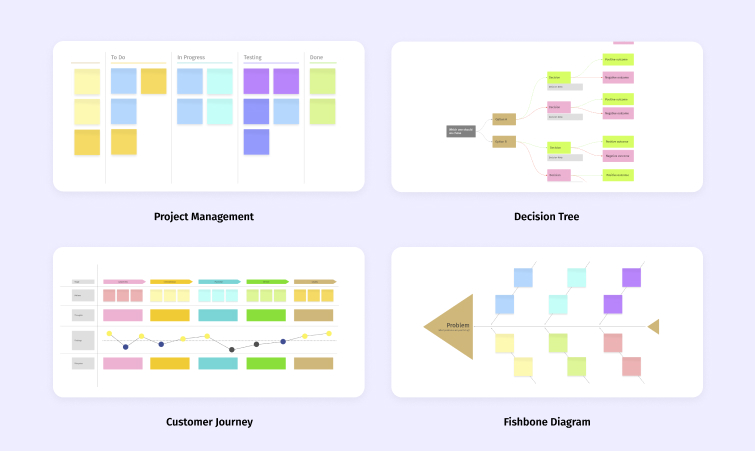
You can create fishbone diagrams using a wide range of tools. Some examples of these tools are Microsoft Excel, Microsoft Word, Microsoft PowerPoint, and more complex graphic design applications, including Figma, Edraw Max, Canva, and Miro. However, you can get started with a simple whiteboard and some post-it notes to organize your categories of issues.
Vibe Interactive Whiteboards
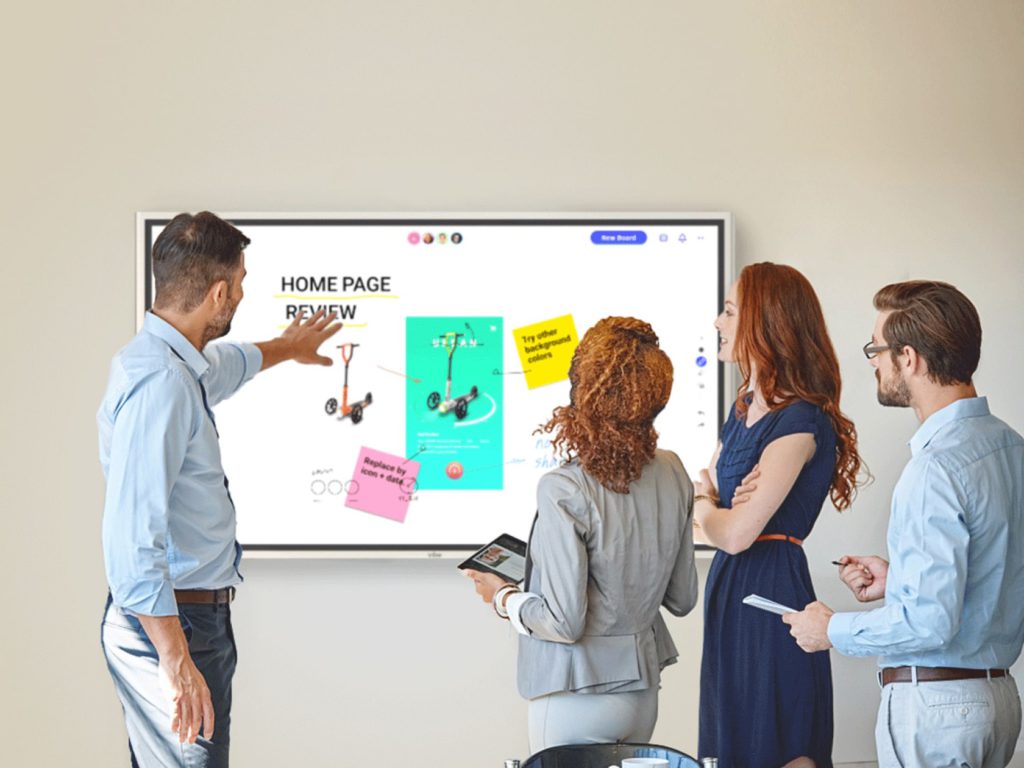
With Vibe Boards, interactive digital whiteboards, you can instantly create and start working on a fishbone diagram using the pre-built Fishbone Diagram Template. With no time wasted building out the diagram, you can focus in on the real issue at hand.
With Vibe’s infinite online whiteboard app, Canvas, you can easily mark up your diagram and add relevant notes and annotations. With the Fishbone Diagram Template, you can quickly and easily add new elements, organize them into groups, and apply consistent formatting to the whole thing so that it looks polished and complete.
The best part? Everything on Canvas is instantly and automatically saved in the cloud. This way, you can easily export and share your diagram to jumpstart discussions with the rest of your team, or anyone not present for the brainstorming session. No more waiting for others to finish their work or losing track of changes to your documents; instead, you can all work together in real time to evaluate and discuss. Before you know it, all your problems will be solved.
{{< blog/cta-download-new content=”S1 Buyers Guide” extra=”false” pdf=”https://vibe.us/pdf/S1-buyers-guide/?utm_campaign=making-a-fishbone-diagram&utm_medium=blog&utm_source=blog”>}}
FAQs
Is there a fishbone diagram template?
Yes, there are a dozen fishbone diagram templates you can use according to your requirements and framework you’re following. Different templates follow different problem solving approaches. For instance, a simple fishbone diagram is the most basic and flexible form whereas the 4S diagram is used more often in a service-oriented company. Vibe Canvas offers a more basic Fishbone Diagram Template that you can add to from any device and easily share with the rest of your team.
What are the 5 steps for creating a fishbone diagram?
Here is the 5-step process to create a fishbone diagram.
- Select a template
- Identify the problem
- Create branches
- Add branches to every category
- Analyze and assess
What can a fishbone diagram be used for?
The use of a fishbone diagram is to analyze and address issues in your company. It helps in gaining a more in-depth understanding of an issue, finding its cause, and developing effective, long-term solutions with the support of your team. It helps you save effort and time while you try to reach your goals.